 Visual Studio
Visual Studio
Visual Studio
Elements in Microsoft Visual Studio 2017, 2019 and 2022
The language and compiler is only half of the story for being productive and creating great apps and solutions.
While Elements comes with its own development environments, Fire and Water, on Windows it also provides integration with Microsoft's Visual Studio IDE, for developers who already have a copy of Visual Studio 2015, 2017 or 2019 (Community, Professional or higher) installed and prefer working in that environment.
Elements seamlessly integrates itself with the existing install, so that you can use Oxygene, RemObjects C#, Swift and Java next to your Visual C# and Visual Basic projects.
The integration with Visual Studio is all-encompassing and extends into virtually every aspect of the IDE, including:
- Project Templates for all Elements languages and platforms.
- Smart Code Editor with IntelliSense and advanced productivity features.
- Full-fledged Debugging experience for all platforms, including cross-network debugging for Mac, Linux and iOS.
- Seamless inter-op with Elements .NET projects and Microsoft Visual C# and Visual Basic projects.
- Full support for Visual Designers including WinForms, WPF, ASP.NET and more.
- Deep integration of EBuild, our custom build chain, with Visual Studio build infrastructure.
 Elements in VS:
Templates
Starting a new development project can be a big step, and Elements provides a wide range of project templates to help you get off the ground with basic application skeletons for just about any scenario imaginable, including Windows and Mac applications, Services, Command line tools, Web sites and mobile apps for iOS, Android or Windows Phone.
Simply Choose "File|New Project", select the kind of application you want to start with, and you're off.
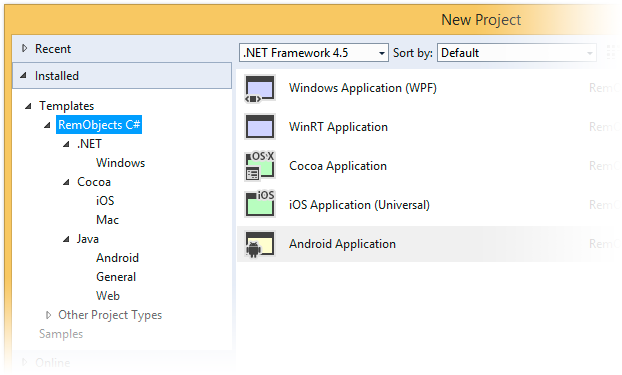
The templates span all sorts of projects you might want to create, from Windows apps using WPF, WinForms or the new WinRT and Mac apps, over services/daemons and web sites to mobile projects for Windows Phone and Android, and of course iOS.
Coding
Elements builds on Visual Studio's code editor and provides significant enhancements.
The Visual Studio code editor is build on WPF — that's an implementation detail, for sure, but it enables Elements to provide a wealth of great graphical features that go beyond displaying mere text.
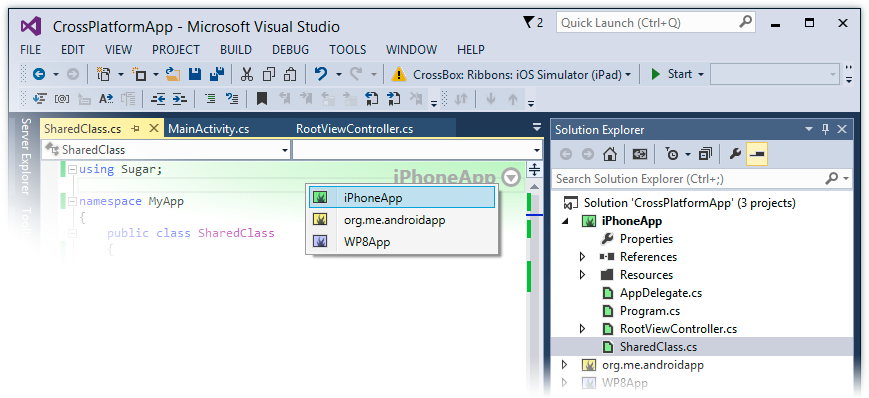
Especially helpful when working with code shared between projects or platforms, the Project Switcher UI gives you an indicator of the project and platform the current source file belongs to, right inside the editor. What's more, if the same code file is shared between several projects, you can switch context within a single click — syntax coloring for IFDEFs, Code Completion and all the IDE smarts will automatically adjust.
A lot of development time is spent navigating around code. Following call trails, skipping through the ancestry of a class, and the like. Every time you navigate around the code, Elements will drop small Navigation Markers, like breadcrumbs, that you can follow along with a single command to get back where you came from, without ever getting lost in your codebase.
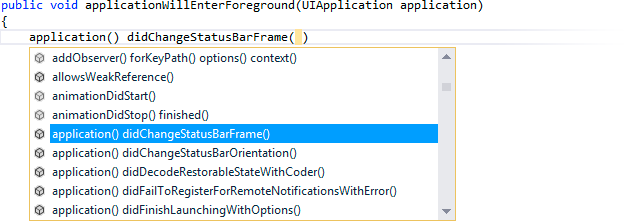
And of course, the code editor provides all the essentials that you need for writing code productively. A powerful Code Completion engine gives you access to all identifiers or keywords valid at the current code location — including smart features, such as showing you types from unreferenced namespaces and automatically inserting the namespace name for you, or "Wizard" code completions that can insert entire blocks of code, such as anonymous method declarations or inline interfaces, for you.
For Oxygene, Class Completion lets you keep your "interface" and "implementation" section in sync with one click, or automatically define fields, local variables or even methods based on the identifier under your cursor with a single keystroke.
Compiling
Elements has a state-of-the-art compiler and tool chain (EBuild) that is not only written completely in managed code, but also in 100% Oxygene and compiles itself. Because the compiler is 100% managed, you can run the command line compiler almost anywhere where .NET and Mono can run — including in your ASP.NET websites, and on Linux and macOS.
But the real power of the modern Elements compiler comes out when used inside the IDEs, where several of its special and more advanced non-language features come to shine.
Inline Errors
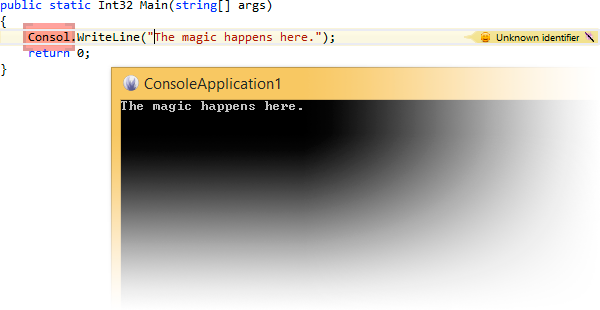
Elements's "Inline Errors" feature directly and visually connects your code with the errors and warnings it may generate — may they be few and far between.

Problems will be highlighted right inside the code editor, with red (error) yellow (warning) and green (hint) markers that show you the exact location of the issue and a short and precise description. Oftentimes, errors are linked with helpful secondary error locations (such as the original occurrence of a duplicate identifier), and Error Ranges are drawn to help you figure out which part of, say, a complex arithmetic expression is causing the problem.
Fix-It and Auto-Fix-It
Many code problems have a clear and obvious fix — a missing semicolon, a misspelled identifier, a type from a namespace that is not in the uses clause. When that is the case, Elements's Inline Errors shows an additional "magic wand" icon, and clicking the error message will bring up a Fix-It panel that lets you easily fix the issue with a single click — without having to touch the code yourself.
What's more, Elements can offer to fix code problems automatically for you as you hit compile, if they are safe to fix. This is incredibly helpful when used in combination with Oxygene's optional "Warn on Case Mismatch" option, or the already case sensitive RemObjects C# and Silver.
Of course this feature is optional, and we only offer it for issues that are 100% safe to auto-fix.

Treat Fixable Errors as Warnings
The compiler can also go a step further and let you "ignore" any code errors that the compiler knows how to fix. This way, when you make a quick code change and press "Start" just to see you mistyped a name or missed a semicolon, your app will still compile and run. The code error will still be there, and you will want to go in and fix it eventually, but at least you did not waste precious time in your debug/change/debug-again cycle.
Gendarme
We also have integrated deep code analysis for .NET into Visual Studio. Based on the open-source Gendarme engine, Elements will analyze your .NET executables after they have been built, and report on a wide range of "code smells" and common coding problems that can't be found by a regular compiler.
You can control the level of analysis via project options — maybe starting out with a light check for serious problems, and later expanding to cover more and smaller issues.

Gendarme integration also makes use of Elements's Inline Error reporting, so you will see its warnings right inside the code editor, marking the relevant lines of code blue. Clicking Gendarme warnings also provides the option to fix problems for you (where available), or to ignore specific warnings, should you ever see false positives.
(Because Gendarme is based on examining .NET assemblies, it is only available for .NET and Mono projects, and does not cover Cocoa or Java applications.)
Debugging
One you've written your code and compiled it, the next step usually is to test and debug your project.
Visual Studio of course comes with a state-of-the-art debugger for .NET, and Elements can take full advantage of that debugger "for free", and builds on top of it by providing deep integration of the Oxygene, C#, Swift and Java languages for evaluating expressions in Watches, hovering over constructs in your code to inspect them, etc.
For debugging Java-based projects, we have gone a step further and integrated a full Java and Android debugging experience with the Visual Studio debugging system, especially for Elements. This allows you to test your Java and Android apps both in the local emulator and on the device, seamlessly from inside Visual Studio, using the same UI paradigms that you may already know from the .NET debugger.
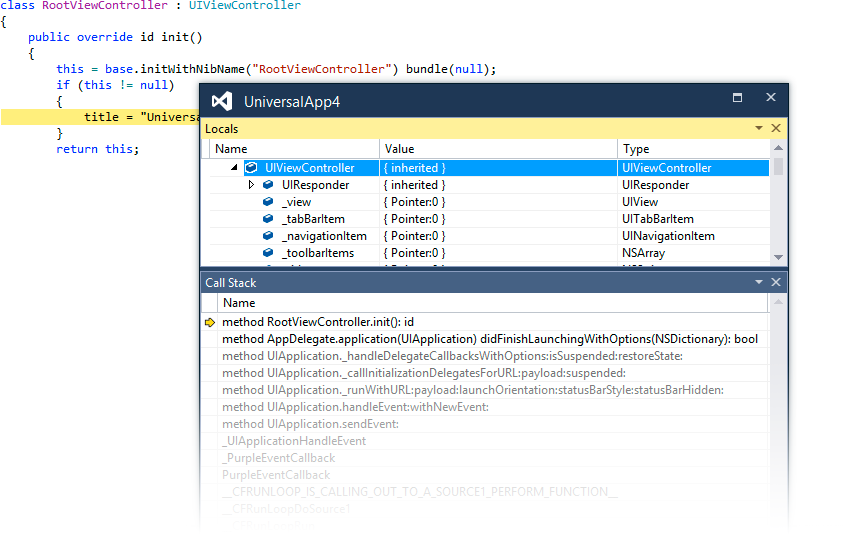
The same is true for testing your Cocoa and Island applications. We have built a full-fledged native debugger for Mac, iOS, Linux and WebAssembly into Visual Studio, based on the powerful LLDB debugger back-end that also drives debugging in Apple's Xcode. You can launch your Cocoa and Island application straight onto your remote Mac, Linux PC, your iOS device or the iOS Simulator, and get the full debugging experience you expect – stepping through code, evaluating fields and variables, catching exceptions.
Regardless of the platform, Elements will not only let you debug your own code, but — provided source code and debug symbols are available — will also let you step through code from Visual C# or Visual Basic, Java or Objective-C libraries you might be using.
To the casual observer it will seem that nothing special is going on here, but in fact two completely unique debug engines for Java, Cocoa and Island, provided by Elements, are used in the background to make this possible.
Full Toolchain Integration for Cocoa and Android
Elements provides sophisticated toolchain integration to let you go from your code to a finished, deployable application, all from within Visual Studio when you press "Build".
CrossBox
The CrossBox menu (and the corresponding CrossBox server application on Mac) lets you manage what external devices you build for – whether your Mac, iOS devices, Android phones, or the iOS Simulator or Android Emulator. Simply pick your target, hit "Build" and/or "Start" and off you go.
For the Cocoa platform, the CrossBox menu is driven by connecting to a small helper server, CrossBox itself, that runs on your Mac(s). This connection lets Elements take care of all the build and deployment tasks necessary – some of which need to happen on a Mac. You do not need to worry about packaging your executable into an .app bundle, code signing it or creating the finished .IPA file for submission to the Apple App Stores – Elements does all of this for you, from the comfort of your IDE. The same goes for deploying apps to your devices for testing or debugging. Connect your iPhone, select it from the CrossBox menu, and your app will get deployed and start on the device. (Read more)
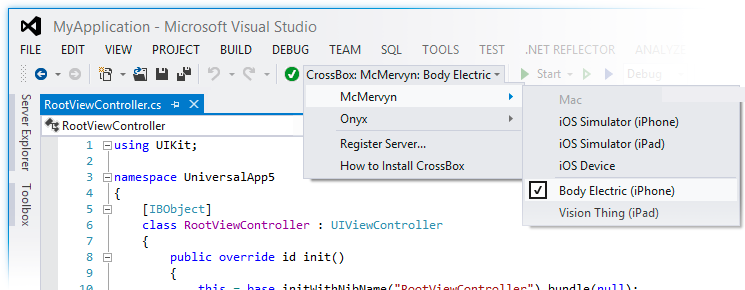
Elements also manages your developer certificates and provisioning profiles (required by Apple for on-device deployment) for you, automatically connecting with your Mac to obtain the necessary information as needed. All you need to do is pick the right certificate and profile you want to use.
For Android, the CrossBox menu gives you access to the Android devices attached to your local PC or VM, as well as any Emulators you have set up. As on Cocoa, debugging on your Android device is as simple as selecting it from the list and hitting "Start"
Start with Instruments
Instruments is a powerful profiling and debugging tool provided by Apple as part of its Xcode toolchest. Elements provides full support for Instruments for Cocoa apps, integrated right into the Visual Studio. Need to debug a performance problem in your app, or want to examine your application's memory footprint? Just press "Start with Instruments", and the application will launch on your Mac or iOS device, connected to Instruments and ready to be profiled. (Read more)

And there's more
The Visual Studio IDE, and Elements's extended support built on top of it, provides a wide range of other features — some big, some really small — that make your life developing code easier.
